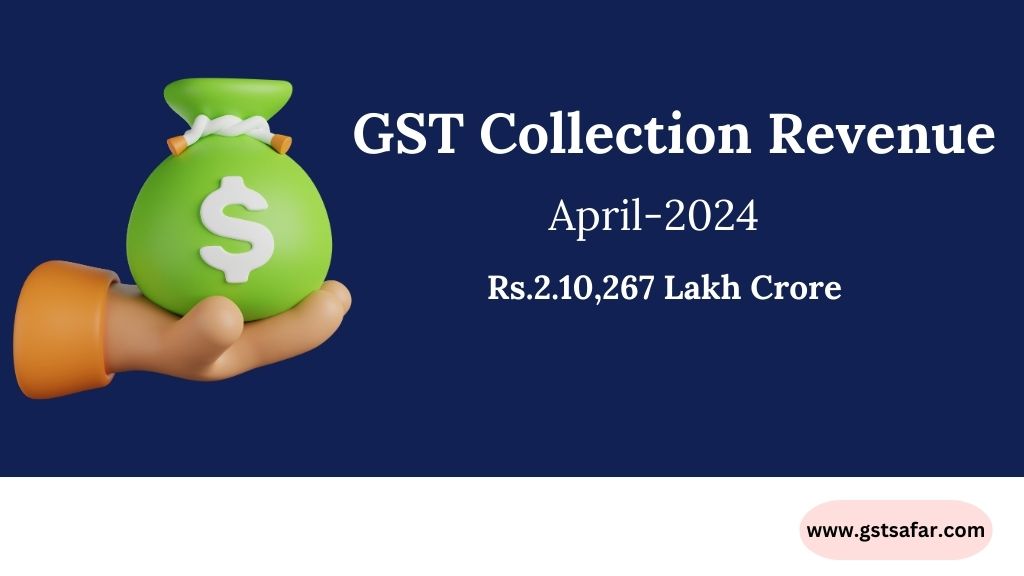
GST Collection April 2024 breach landmark milestone of Rs.2 Lakh Crore
Gross GST revenue records 12.4% y-o-y growth and net revenue (after refunds) stood at Rs.1.92 lakh crore with 15.5% y-o-y growth.
Here the GST revenue Collection 2024 is compared with the same month of last year. That means, it is compared with GST Collection April 2023.
| GST Revenue Collection | Amount ₹ |
|---|---|
| Gross GST Revenue Collection April 2024 | 2,10,267 Crore |
| Gross GST Revenue Collection April 2023 | 1,87,035 Crore |
GST Collection April 2024 summary
| GST | Amount ₹ |
|---|---|
| Total GST Revenue | 2,10,267 Crore |
| CGST Revenue | 43,846 Crore |
| SGST Revenue | 53,538 Crore |
| IGST Revenue from Import of goods | 37,826 Crore |
| IGST Revenue from Domestic | 61,797 Crore |
| Cess Revenue from Import of goods | 1008 Crore |
| Cess Revenue from Domestic | 12,252 Crore |
Settlement from IGST Revenue April 2024
| IGST Settlement | Amount ₹ |
|---|---|
| IGST settled to CGST | 50,307 Crore |
| IGST settled to SGST | 41,600 Crore |
| Total CGST Revenue after settlement from IGST (43846+50307) | 94,153 Crore |
| Total SGST Revenue after settlement from IGST (53538+41600) | 95,138 Crore |
GST Collection April 2024 State-wise as compared to April 2023
In the following table GST Collection April 2024 has been bifurcated in various states and the same has been compared with GST collection of April 2023 state wise and it is measured in terms of GST Collection growth.
| State | GST Revenue April-23 ₹ in Crore | GST Revenue April-24 ₹ in Crore | Growth of GST Collection |
|---|---|---|---|
| Jammu and Kashmir | 803 | 789 | -2% |
| Himachal Pradesh | 957 | 1015 | 6% |
| Punjab | 2316 | 2796 | 21% |
| Chandigarh | 255 | 313 | 23% |
| Uttarakhand | 2148 | 2239 | 44% |
| Haryana | 10035 | 12168 | 21% |
| Delhi | 6320 | 7772 | 23% |
| Rajasthan | 4785 | 5558 | 16% |
| Uttar Pradesh | 10320 | 12290 | 19% |
| Bihar | 1625 | 1992 | 23% |
| Sikkim | 426 | 403 | -5% |
| Arunachal Pradesh | 238 | 200 | -16% |
| Nagaland | 88 | 86 | -3% |
| Manipur | 91 | 104 | 15% |
| Mizorum | 71 | 108 | 52% |
| Tripura | 133 | 161 | 20% |
| Meghalaya | 239 | 234 | -2% |
| Assam | 1513 | 1895 | 25% |
| West Bengal | 6447 | 7293 | 13% |
| Jharkhand | 3701 | 3829 | 3% |
| Odisha | 5036 | 5902 | 17% |
| Chhattisgarh | 3508 | 4001 | 14% |
| Madhya Pradesh | 4267 | 4728 | 11% |
| Gujarat | 11721 | 13301 | 13% |
| Dadra and Nagar Haveli and Daman and Diu | 399 | 447 | 12% |
| Maharashtra | 33196 | 37671 | 13% |
| Karnataka | 14593 | 15978 | 9% |
| Goa | 620 | 765 | 23% |
| Lakshadweep | 3 | 1 | -57% |
| Kerala | 3010 | 3272 | 9% |
| Tamil Nadu | 11959 | 12210 | 6% |
| Puducherry | 218 | 247 | 13% |
| Andaman and Nicobar Islands | 92 | 65 | -30% |
| Telangana | 5622 | 6236 | 11% |
| Andhra Pradesh | 4329 | 4850 | 12% |
| Ladakh | 68 | 70 | 3% |
| Other Territory | 220 | 225 | 2% |
| Center Jurisdiction | 187 | 221 | 18% |
| Grand Total | 1,51,162 | 1,71,433 | 13% |
Amount of SGST & SGST portion of IGST settled to states/UT in April 2024.(Rs. in crore)
| State/UT | Pre-Settlement SGST | Pre-Settlement SGST | Pre-Settlement SGST | Post-Settlement SGST | Post-Settlement SGST | Post-Settlement SGST |
|---|---|---|---|---|---|---|
| Apr-23 | Apr-24 | Growth | Apr-23 | Apr-24 | Growth | |
| Jammu and Kashmir | 394 | 362 | -8% | 918 | 953 | 4% |
| Himachal Pradesh | 301 | 303 | 1% | 622 | 666 | 7% |
| Punjab | 860 | 999 | 16% | 2090 | 2216 | 6% |
| Chandigarh | 63 | 75 | 20% | 214 | 227 | 6% |
| Uttarakhand | 554 | 636 | 15% | 856 | 917 | 7% |
| Haryana | 1871 | 2172 | 16% | 3442 | 3865 | 12% |
| Delhi | 1638 | 2027 | 24% | 3313 | 4093 | 24% |
| Rajasthan | 1741 | 1889 | 9% | 3896 | 3967 | 2% |
| Uttar Pradesh | 3476 | 4121 | 19% | 7616 | 8494 | 12% |
| Bihar | 796 | 951 | 19% | 2345 | 2688 | 15% |
| Sikkim | 110 | 69 | -37% | 170 | 149 | -12% |
| Arunachal Pradesh | 122 | 101 | -17% | 252 | 234 | -7% |
| Nagaland | 36 | 41 | 14% | 107 | 111 | 4% |
| Manipur | 50 | 53 | 6% | 164 | 133 | -19% |
| Mizorum | 41 | 59 | 46% | 108 | 132 | 22% |
| Tripura | 70 | 80 | 14% | 164 | 198 | 21% |
| Meghalaya | 69 | 76 | 9% | 162 | 190 | 17% |
| Assam | 608 | 735 | 21% | 1421 | 1570 | 10% |
| West Bengal | 2416 | 2640 | 9% | 3987 | 4434 | 11% |
| Jharkhand | 952 | 934 | -2% | 1202 | 1386 | 15% |
| Odisha | 1660 | 2082 | 25% | 2359 | 2996 | 27% |
| Chhattisgarh | 880 | 929 | 6% | 1372 | 1491 | 9% |
| Madhya Pradesh | 1287 | 1520 | 18% | 2865 | 3713 | 30% |
| Gujarat | 4065 | 4538 | 12% | 6499 | 7077 | 9% |
| Dadra and Nagar Haveli and Daman and Diu | 62 | 75 | 22% | 122 | 102 | -16% |
| Maharashtra | 10392 | 11729 | 13% | 15298 | 16959 | 11% |
| Karnataka | 4298 | 4715 | 10% | 7391 | 8077 | 9% |
| Goa | 237 | 283 | 19% | 404 | 445 | 11% |
| Lakshadweep | 1 | 0 | -79% | 18 | 5 | -73% |
| Kerala | 1366 | 1456 | 7% | 2986 | 3050 | 2% |
| Tamil Nadu | 3682 | 4066 | 10% | 5878 | 6660 | 13% |
| Puducherry | 42 | 54 | 28% | 108 | 129 | 19% |
| Andaman and Nicobar Islands | 46 | 32 | -32% | 78 | 88 | 13% |
| Telangana | 1823 | 2063 | 13% | 3714 | 4036 | 9% |
| Andhra Pradesh | 1348 | 1621 | 20% | 3093 | 3552 | 15% |
| Ladakh | 34 | 36 | 7% | 55 | 61 | 12% |
| Other Territory | 22 | 16 | -26% | 86 | 77 | -10% |
| Grand Total | 47,412 | 55,538 | 13% | 85,371 | 95,138 | 11% |
Read similar article
